We use cookies for personalizing content and ads and providing social media features. Your usage information on our website will be used for social media, advertising, and traffic analytics, or shared with our partners. Clicking "Accept" means you agree to use our cookies .
Summary: This article tests the read and write speed of 5 SATA 3 SSD in order to find which one has the best performance and tells you how to choose a good performance SSD from dozens of Solid State Disks.
The three most important parts of a computer are CPU, memory and disk . For most users, it is an easy and quickly way to upgrade HDD to SSD if they want to speed up a computer and get the better performance. This article reviews 5 cheapest SATA 3 SSDs. Let's go and see which one has the best speed.
1. Sequential read speed, Sequential write speed: Reading and writing speed can directly reflect the SSD performance. In general, read and write speeds are the Sequential read and write speed.
2. What is SLC, MLC, TLC: In general, SLC is the best one of them, MLC is the second, TLC is the worst one. But SLC is the most expensive one while TLC is in most common used. More details please see Particle.
3. Controller: A good controller can make SSD run faster and longer. It is the brain of SSD. More details please see Controller.
4.Cache: Cache module can effectively improve the SSD performance. The more the cache have, the faster the SSD will be. More details please see Cache.
Operating system: Windows 10 Enterprise 64-bit (DirectX 12)
4K alignment & AHCI & TRIM: On
Test methods
1. Using AS SSD Benchmark
2. Using ATTO Disk Benchmark
3. Using the official SSD management software
4. Using the command prompt
Test results for 5 SSDs
1. Sequential/Random read and write - Test with AS SSD Benchmark
1.1 Sequential reading and writing speed for 5 SSDs(Test tool: AS SSD Benchmark; Blank disk)
Sequential reading and writing test are for large, centralized and contiguous files. These files will follow the order in reading and writing process. SSD with higher sequential reading and writing capability works faster in processing large files.
Sequential reading and writing speed
The upper part of the same item is Reading grade, the lower part is Writing grade.
Red color represents the highest score, Blue color represents the lowest score.
Toshiba Q200 EX
Toshiba TR200
Intel 545s
Samsung 860 EVO
SanDisk SSD Plus
1G Seq (MB/s)
515.46
516.74
521.45
519.73
517.63
469.25
462.27
475.61
496.91
425.34
1G 4K (MB/s)
20.06
38.28
33.32
38.88
8.16
66.48
69.81
71.9
76.52
35.14
1G 4K-64 Thrd (MB/s)
353.98
319.57
295.21
374.42
8.75
187.36
379.72
267.49
333.89
101.02
1G Acc.time (ms)
0.167
0.053
0.052
0.05
0.437
0.048
0.165
0.048
0.043
0.599
10G Seq (MB/s)
515.25
510.56
521.43
522.44
511.53
477.7
130.64
292.55
498.11
141.6
10G 4K (MB/s)
19.53
25.76
31.28
31.38
7.8
64.94
43.58
71.36
74.98
10.85
10G 4K-64Thrd (MB/s)
347.35
244.6
293.77
370.98
8.5
159.56
58.99
235.15
264
13
10G Acc.time (ms)
0.17
0.06
0.057
0.056
0.431
0.528
3.708
0.482
0.442
7.281
In the sequential test, Toshiba TR200 showed an extremely unstable performance: some of the performance was better than Toshiba Q200 EX in the 1G test environment; while switching to the 10G test environment, the performance declined and some of the performance data even dropped dramatically.
The performance of SanDisk SS Plus also fluctuated. When the test environment switched from 1G to 10G, the SSD's writing performance declined significantly.
Although Toshiba TR200 had a significant performance drop, it is better than SanDisk SSD Plus
1.2Random Reading and writing speed(Test tool: AS SSD Benchmark; Blank disk)
Random reading and writing test are for small, scattered and random files. For these files, reading and writing process is out of order. They can jump to a random file without following the order of files..
As the startup of computer and the running of programs are mainly based on small files, SSD with good random reading and writing ability will make the computer startup more quickly and the programs run more smoothly. SSD with higher random reading and writing speed have better performance for small files.
Random Reading and writing speed
The upper part of the same item is Reading grade, the lower part is Writing grade.
Red color represents the highest score, Blue color represents the lowest score.
Toshiba Q200 EX
Toshiba TR200
Intel 545s
Samsung 860 EVO
SanDisk SSD Plus
1G 16MB (iops)
32.13
32.49
32.74
30.85
32.02
28.75
27.52
24.58
28.93
25.6
1G 4K (iops)
4572
9552
8254
5642
1791
17460
16612
17804
18947
8747
1G 4K-64 Thrd (iops)
89780
87645
74593
91935
2388
57124
69872
67770
77891
25520
1G 512B (iops)
5103
17458
15355
12611
---
19195
5758
19680
21664
1659
10G Seq (MB/s)
32.19
31.35
32.89
32.55
32.12
28.47
7.99
18.38
30.47
8.98
10G 4K (MB/s)
4443
5650
7064
7403
1605
17117
10611
18012
19192
2748
10G 4K-64Thrd (MB/s)
88599
62429
73436
91807
2198
48644
22129
69814
75864
3828
10G Acc.time (ms)
5069
15528
14202
16474
---
1901
262
1969
2176
140
Toshiba TR200 and SanDisk SSD Plus still have serious performance fluctuations but the difference is that Toshiba TR200 only shows a significant decline in writing.
Only SanDisk SSD Plus failed to display 512B 's random reading data.
In addition, the 10G 512B writing data of the five disks was significantly lower than the 1G 512B writing data of them.
1.3 The sequential reading and writing speed after the SSD using a half of the capacity(Test tool: AS SSD Benchmark)
As the available capacity decreases, there are fewer and fewer particles available to write. It will weaken the SSD's performance. Therefore, it is necessary to make an estimate of using before selecting SSD. At the same time, choosing a famous brand and high quality production are the good ways to ensure the stability of SSD performance.
The sequential reading and writing speed after the SSD using a half of the capacity.
The upper part of the same item is Reading grade, the lower part is Writing grade.
Red color represents the highest score, Blue color represents the lowest score.
Toshiba Q200 EX
Toshiba TR200
Intel 545s
Samsung 860 EVO
SanDisk SSD Plus
1G Seq (MB/s)
511.54
513.12
520.06
518.75
511.58
95.48
419
401.76
465.89
139.74
1G 4K (MB/s)
19.82
38.5
33.45
39.53
8.28
55.24
68.52
71.87
75.37
29.98
1G 4K-64 Thrd (MB/s)
343.59
372.6
297.99
374.64
8.64
69.18
325.01
253.32
275.12
60.22
1G Acc.time (MB/s)
0.187
0.052
0.091
0.089
0.555
0.059
0.156
0.048
0.047
1.413
10G Seq (MB/s)
511.87
503.19
522.34
519.83
513.96
125.78
130.08
285.71
496.78
145.18
10G 4K (MB/s)
19.59
25.39
31.07
31.34
6.35
54.26
43.44
70.91
74.3
10.61
10G 4K-64Thrd (MB/s)
330.23
243.85
296.04
370.42
7.5
61.73
87.2
232.92
265.39
12.17
10G Acc.time (ms)
0.189
0.059
0.096
0.096
0.59
0.692
3.843
0.511
0.468
6.741
After using more than half of capacity, Toshiba Q200 EX's writing performance dropped significantly.
Toshiba TR200 is relatively stable. The sequential writing performance of SanDisk SSD Plus decreased significantly in 1G test environment but remained stable in 10G test environment. The other two sets' performance maintain a high level.
1.4 The random reading and writing speed after the SSD using a half of the capacity(Test tool: AS SSD Benchmark)
The random reading and writing speed after the SSD using a half of the capacity.
The upper part of the same item is Reading grade, the lower part is Writing grade.
Red color represents the highest score, Blue color represents the lowest score.
Toshiba Q200 EX
Toshiba TR200
Intel 545s
Samsung 860 EVO
SanDisk SSD Plus
1G 16MB (iops)
32.15
16.56
16.64
32.17
32.01
5.98
15.08
15.36
18.77
22.7
1G 4K (iops)
4554
8914
6701
7716
1769
14763
13879
15768
19101
5308
1G 4K-64 Thrd (iops)
87105
44072
43472
91871
2268
17564
41124
45308
70309
17328
1G 512B (iops)
4928
15969
9310
10840
---
13363
5361
18993
21679
1591
10G Seq (MB/s)
32.21
16.54
16.67
32.59
32.16
8.02
6.5
15.37
21.32
8.16
10G 4K (MB/s)
4436
5620
6652
7664
1547
13350
9924
15845
19232
2799
10G 4K-64Thrd (MB/s)
84999
38516
43293
91088
2176
19977
18145
45332
74932
3594
10G Acc.time (ms)
4799
13695
9050
10184
1714
1415
263
1899
2179
127
Toshiba Q200 EX's random writing performance decreased after the capacity was more than half used. But the random reading performance of it was basically stable. Toshiba TR200 showed multi-faceted performance degradation. The other three SSDs showed stable and reliable performance.
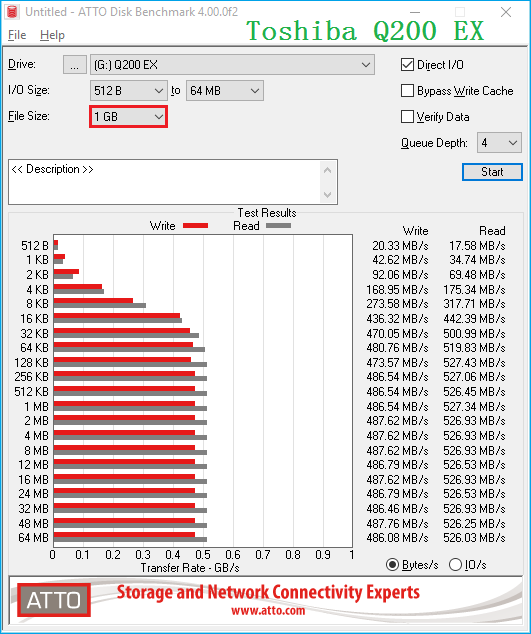
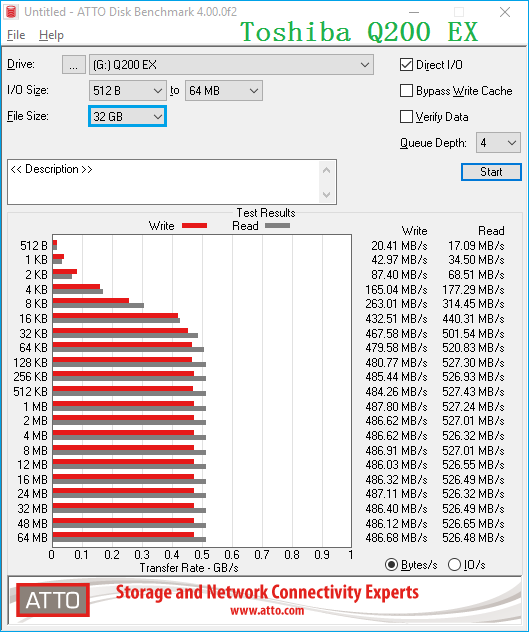
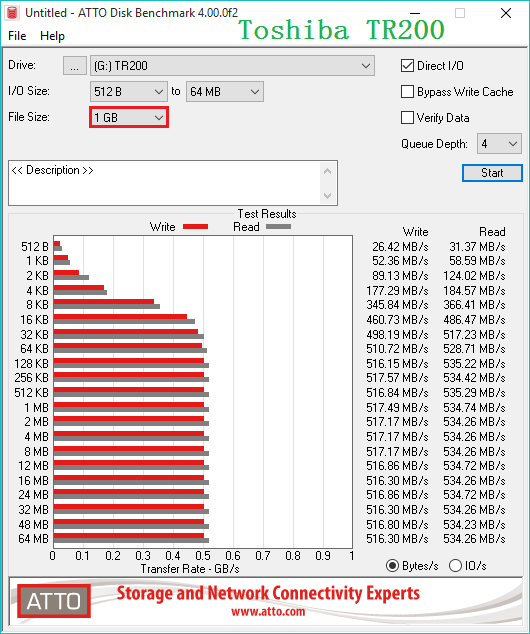
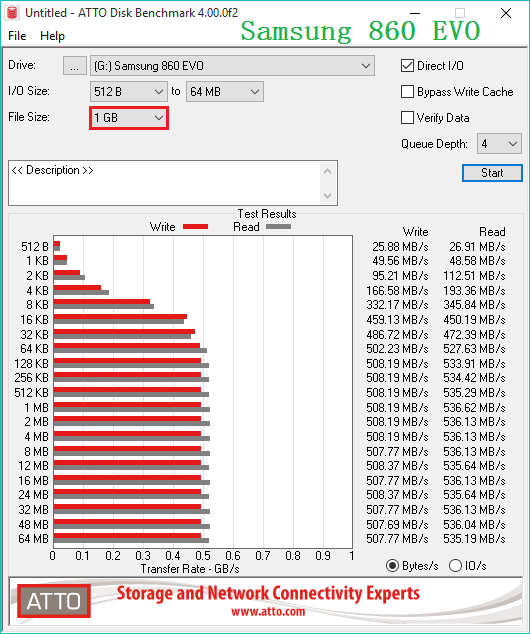
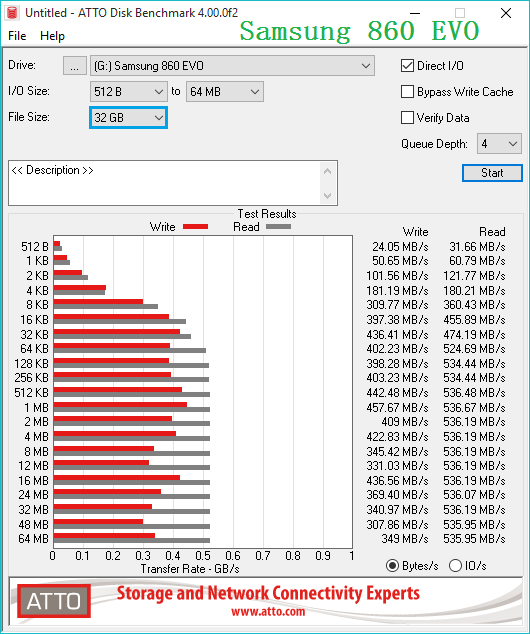
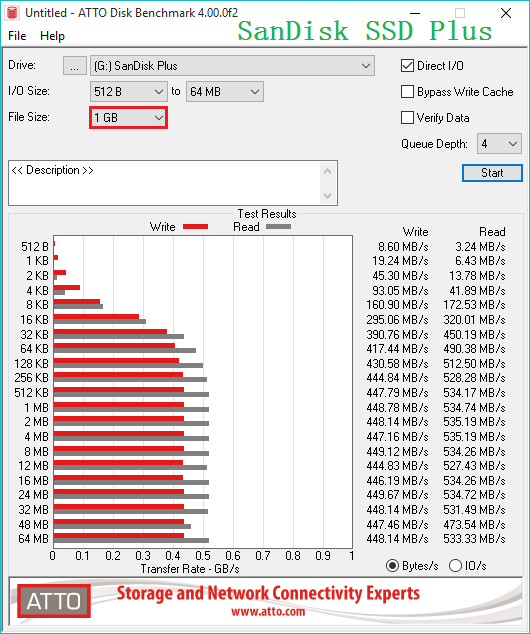
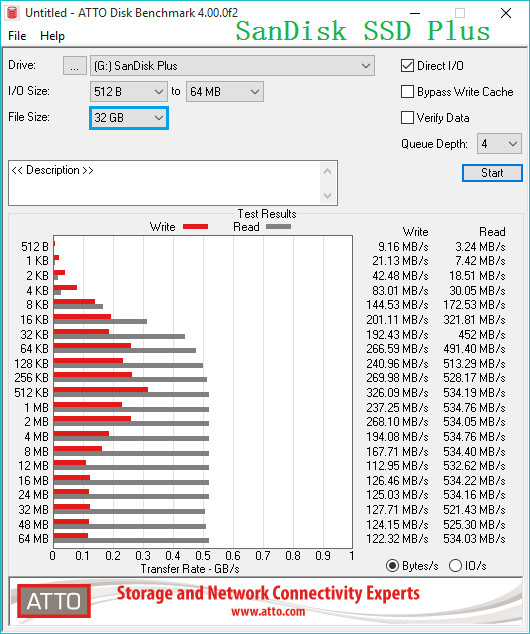
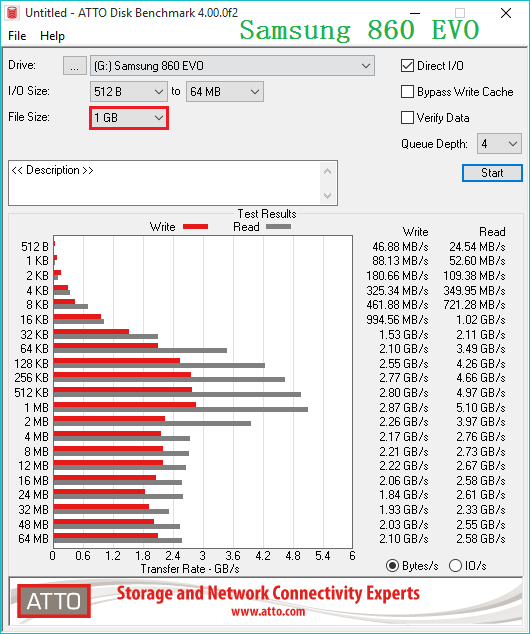
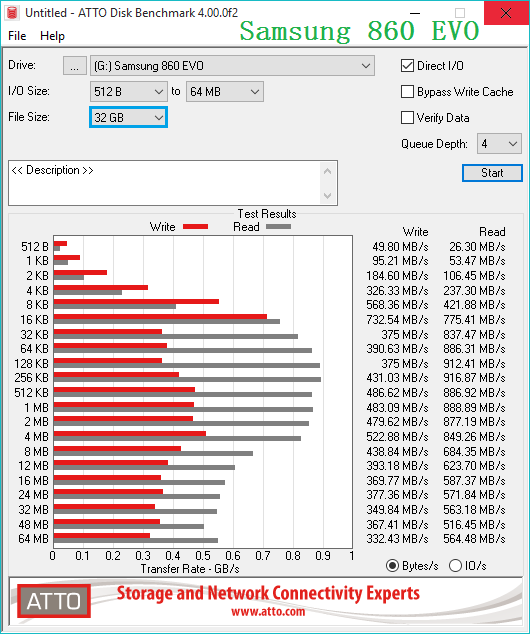
2. Reading and writing speed of specified size files - Test with ATTO Disk Benchmark
By using the ATTO Disk Benchmark, you can see at a glance that how fast when SSD handle files of different sizes.
Toshiba Q200 EX maintains stable and high reading and writing speed in both 1 GB and 32 GB test environments.
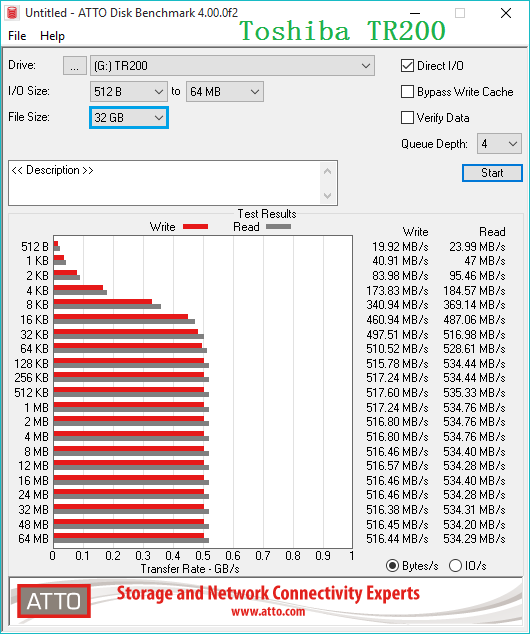
Toshiba TR200 maintained stable performance in test too. Compared with Toshiba Q200 EX, its reading and writing speed is better but the writing advantage is more prominent.
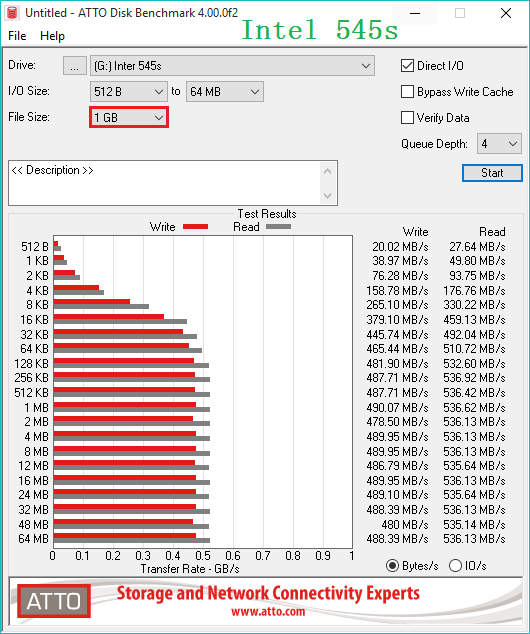
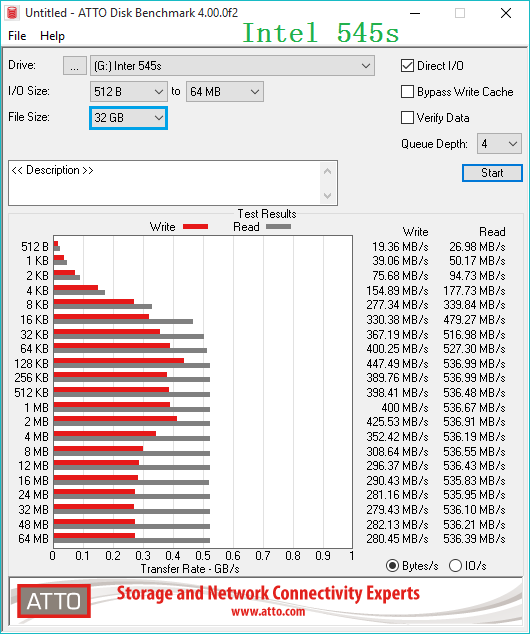
Intel's performance fluctuates significantly in 32 GB test environment especially after the 2 MB file.
Samsung 860 EVO also fluctuates repeatedly after 2 MB files in 32 GB test environment.
The performance of SanDisk SSD Plus was not optimistic in either 1 GB or 32 GB test environment. The writing ability of SanDisk SSD Plus plummeted in 32 GB test environment. Because of the biggest writing performance fluctuation, SanDisk SSD Plus become the worst among the five.
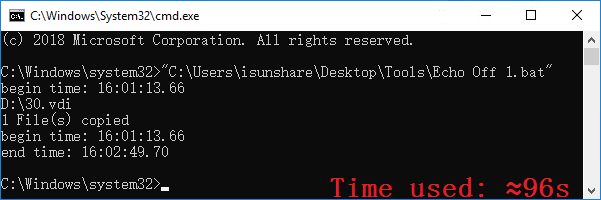
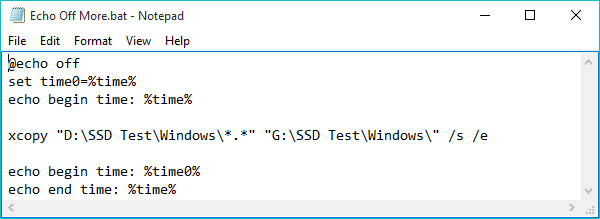
3. Single and multiple 30 GB file(s) transfer in continuous and discontinuous conditions - Test with command prompt
To explore the performance differences between the five SSDs more intuitively, we let them write single and multiple 30 GB files in continuous and discontinuous conditions respectively. In these processes we use Command Prompt to return the time. We chose Kingston A100(m.2 Socket 3, NVMe protocol support, 240 GB) as the data source. All SSDs in the actual test are full load. At the same time, we tested 3 to 4 times for each data transmission and took the median value.
Toshiba Q200 EX writes a single 30 GB file in continuous condition: about 96s.
Toshiba Q200 EX writes a single 30 GB file in discontinuous condition: about 88s.
Toshiba Q200 EX writes multiple 30 GB files in continuous condition: about 286s.
Toshiba Q200 EX writes multiple 30 GB files in discontinuous condition: about 285s.
Review: According to the continuous and discontinuous test data, Toshiba Q200 EX has the best transmission performance among the five SSDs. Only the single 30 GB file's transfer speed is slightly slower than Toshiba TR200.
Toshiba TR200 writes a single 30 GB file in continuous condition: about 93s.
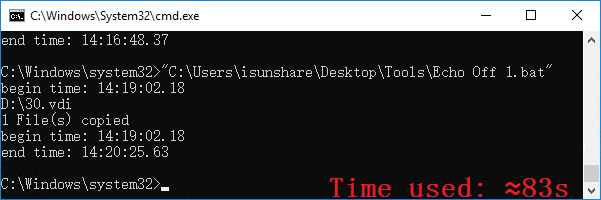
Toshiba TR200 writes a single 30 GB file in discontinuous condition: about 83s.
Toshiba TR200 writes multiple 30 GB files in continuous condition: about 550s.
Toshiba TR200 writes multiple 30 GB files in discontinuous condition: about 514s.
Review: Toshiba TR200's single 30 GB file transfer capacity is the best among the five SSDs. The time of transfer are less than 100s. However, the performance of transfer 30 GB multiple files greatly reduces, which takes up to 500s directly. It can be seen that Toshiba TR200 has poor random reading and writing performance.
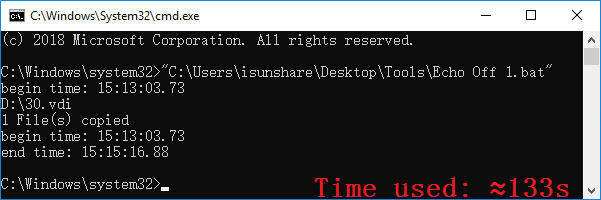
Intel 545s writes a single 30 GB file in continuous condition: about 133s.
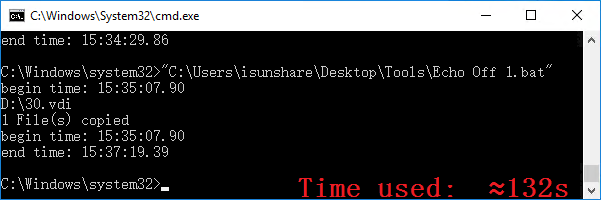
Intel 545s writes a single 30 GB file in discontinuous condition: about 132s.
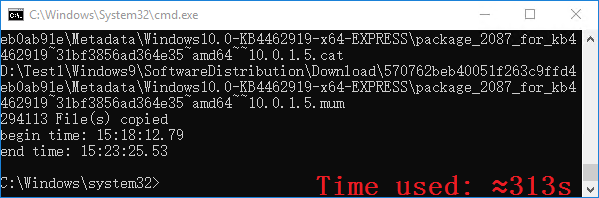
Intel 545s writes multiple 30 GB files in continuous condition: about 313s.
Intel 545s writes multiple 30 GB files in discontinuous condition: about 305s.
Review: Intel 545s ranks in the middle of five SSDs. Whether for the single file or multiple files transmission, it shows a good and stable transmission property.
The Samsung 860 EVO writes a single 30 GB file in continuous condition: about 100s.
Samsung 860 EVO writes a single 30 GB file in discontinuous condition: about 112s.
Samsung 860 EVO writes multiple 30 GB files files in continuous condition: about 288s.
Samsung 860 EVO writes multiple 30 GB files in discontinuous condition: about 286s.
Review: Samsung 860 EVO ranks the second in the blank disk test. It is just slightly weaker than Toshiba's Q200 EX in single file transfer.
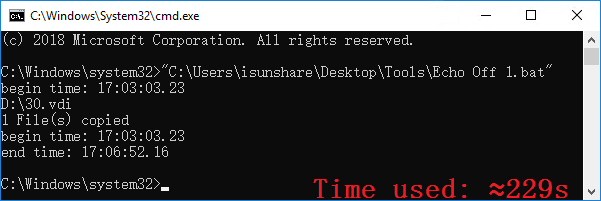
SanDisk SSD Plus writes a single 30 GB file in continuous condition: about 229s.
SanDisk SSD Plus writes a single 30 GB file in continuous condition: about 309s.
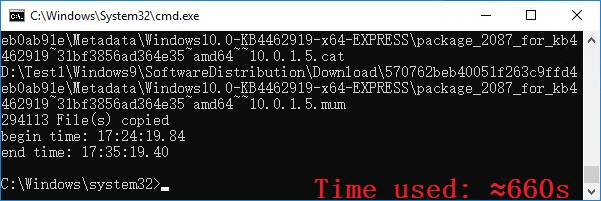
SanDisk SSD Plus writes multiple 30 GB files file in continuous condition: about 617s.
SanDisk SSD Plus writes multiple 30 GB files file in discontinuous condition: the time is about 660s.
Review: SanDisk SSD Plus has the lowest score of any project. These data indicates that its data transmission capacity is not good enough. In the discontinuous condition, the transmission time of it exceeds 600s.
Review summary for 5 Solid State Disks
Toshiba Q200 EX
Toshiba TR200
Intel 545s
Samsung 860 EVO
SanDisk SSD Plus
Performance
★★
★★★
★★★★
★★★★★
★
Life
---
★
★★
★★★
---
Price
★
★★★★
★★★
★★
★★★★★
Comprehensive
★★★
★★
★★★★
★★★★★
★
Toshiba Q200 EX (★★★):
As a SSD with MLC particle, Toshiba Q200 EX should have a better experience than TLC particle SSDs. Toshiba Q200 EX' s comprehensive performance is impressive when storage space is abundant. But its speed and performance are significantly down after it is used more than a half of the capacity.In addition, it fails to find a matching SSD management software. The losing of management software makes users' SSD monitoring and maintenance in cumbersome situation.
Toshiba TR200 (★★):
Toshiba TR200 works well on a small data scale. But when switching to large data scale (especially writing), its performance drops significantly. When doing large-scale data writing, we can see that Toshiba TR200's transmission speed is high at first, but then the speed gradually drops to a stable value (about 100 MB/s). This is because SSDs with many TLC particles will make some TLC particles work as SLC particles. They call it SLC cache. SLC cache is limited and when it is used up, SSD reading and writing is in full TLC particle mode. This why many TLC particles SSDs have a peak at the beginning of data transmission.In addition, it is the only one of the fives that requires more than 2 minute interval between performance tests. If the interval is too close, the test data will not have credibility because the performance data is too low.
Intel 545s (★★★★):
Intel 545s is the most balanced performance SSD. It comes with 256-bit AES algorithm encryption. Although it is the world's first SSD product which uses 64-layers of 3D TLC technology, the comprehensive performance isn't so high. Its advantages maybe 256 MB caching , a five-year warranty and more stable performance.
Samsung 860 EVO (★★★★★):
Samsung 860 EVO is the SSD with the best performance which is balanced and stable. It also has the highest 512 MB cache, warranty standard (5-year or 150TB TBW warranty), the better management software and more diverse encryption algorithms (256-bit AES, TCG Opal, IEEE1667). The RAPID mode also makes it show stronger performance. Samsung 860 EVO is worth recommending.
SanDisk SSD Plus (★):
In the five SSDs' tested, SanDisk SSD Plus performs the worst either sequential or random. It 's hard to imagine that it is SSD. Although MLC particles are used (SanDisk 05446 064G), the lower version controller seems to limit the performance. Toshiba Q200 EX has a similar condition to it. It should be noted that there is more than one version of controller in SanDisk SSD Plus. If the firmware starts with U, it uses Silicon Motion SMZZ46XT controller, which is the low version and is criticized by the common people.
We are nearing the end of the test and we rank them from good to bad: Samsung 860 EVO Intel 545s Toshiba Q200 EX Toshiba TR200 SanDisk SSD Plus. Thank you.
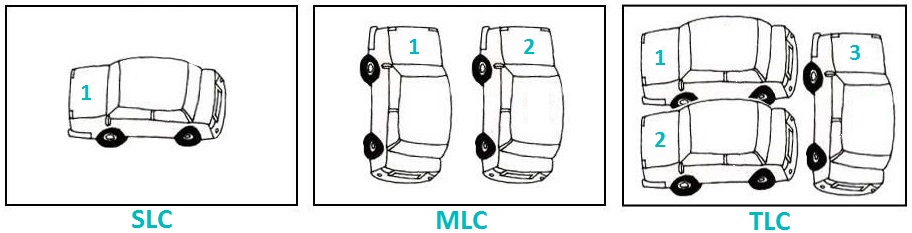
SLC: S means Single. Each storage unit of SLC only stores 1 bit of data. This method enables SLC to have extremely high stability, reading and writing speed, service life and the lowest error rate. At the same time, the price of it is the highest of the three.
MLC: M means Multi. Each storage unit stores 2 bits of data.
TLC: T is Triple. Each storage unit stores 3 bits of data. (Some manufactures label TLC as 3 bits MLC.)
These three particles store data as follows:
The life span of the above three particles is SLC MLC TLC. Particles just like the parking lots. The more cars there are, the shorter their life span will be. But it should be noted that although TLC with the shortest life of particles, even in heavy use, it is not a problem to use it for 3 to 5 years. In addition, the SSD will have longer life if it has big capacity regardless of the particle.
TLC becomes the most common consumer SSD particle due to its affordable price and good adaptability for most users.
Toshiba Q200 EX uses its own 19nm MLC particles (A19). This particle's life and performance have been tested by market. It has in high competition.
Toshiba TR200 is the first retail 3D NAND SSD of Toshiba.
Intel 545s is the world's first SSD using 64-layers 3D TLC technology.
SanDisk SSD Plus does not disclose which particles were used, but its controller Silicon Motion SM2246XT only supports SLC and MLC particles. So it can be speculated that MLC particles are used in this SSD.
2. Controller
As is mentioned above, we compare the storage space to a parking lot, the controller is the dispatcher of it.
A good dispatcher can help all the cars become orderly and fast access. A bad dispatcher make them become congested and slow access. These situations reflected in the computer are the smooth or stuck experience.
Compared with SLC and MLC, the situation of TLC is more complex and changeable. So it is more necessary to have a qualified and excellent controller. Famous controller brands include Marvell, Samsung, Toshiba etc. In recent years, Taiwan's controllers,such as Phison, Silicon Motion,are developed rapidly.
Toshiba Q200 EX's controller was developed by Marvell and Toshiba. It does not support 256-bit AES encryption. Toshiba TR200 use the controller developed by Phison. The controller of SanDisk SSD Plus only supports SLC and MLC particles.
3. Cache
Because the speed of CPU and RAM is much faster than SSD, sometimes a large amount of data need to be written in a moment. However, SSD cannot write all data in a moment. There are some SSDs add the cache module to store data quickly. When the instantaneous data can be quickly stored by the cache module for next writing, we won't feel the slow caused by disk.
Intel 545s has not disclose the built-in cache space, but there is some information which indicates that the design scheme allocates 1 MB cache space for 1 GB. So it can be speculated that the cache space of Intel 545s should be 256MB.
The Samsung 860 EVO 's cache is its own low-power DDR4 SDRAM.
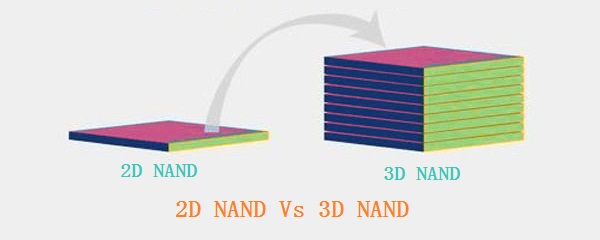
4. 3D NAND Stack Technology
Compared with the planar parking lot, the three-dimensional parking lot can store more vehicles in limited space. The emergence of 3D NAND technology simulates the construction of three-dimensional parking lot. Currently, we can experience the 96-layer 3D NAND technology.
Three-dimensional storage structure can not only reduce the interference between storage units, but also bring lower temperature and power consumption. As the result, the performance of SSD is further improved.
5. Reading and writing life
Reading and writing life is a reliable indicator which showcases whether a SSD is durable or not. Generally, 240 GB TLC particles SSD usually have more than 100TB TBW (Total Bytes Written). The TBWwhich is just for writing, reading operation won't affect the SSD's servive life.
6. Whether 256-bit AES encryption is supported
The emergence of encryption technology effectively protects sensitive data. If you lost your small SSD accidentally, others can't read the stored data without your key. Currently some SSDs support 256-bit AES algorithm encryption or are compatible with TCG Opal, IEEE1667 encryption.
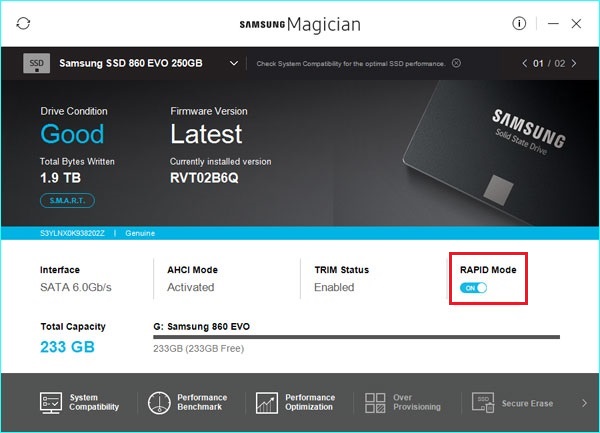
7. RAPID mode
The RAPID mode of SSD invokes a portion of RAM space as its cache will greatly improve reading and writing capability. It should be noted that the RAPID mode function requires certain RAM space and it can be turned on in SSD management tools.
In the five SSD products, only the Samsung 860 EVO has PAPID mode. During the experiment, we compared the speed difference between the RAPID mode on and off. The result of the test was amazing but the actual experience depends on the daily use test.
Samsung 860 EVO's sequential reading and writing speed comparison with RAPID mode OFF and ON (Test tool: AS SSD Benchmark; Blank disk) :
Sequential
Normal mode
RAPID mode
1G Seq (MB/s)
519.73
1740.07
469.91
1794.10
1G 4K (MB/s)
38.88
60.09
76.52
248.30
1G 4K-64 Thrd (MB/s)
374.41
4488.18
333.89
7394.72
1G Acc.time (ms)
0.050
0.051
0.043
0.019
10G Seq (MB/s)
522.44
580.83
498.11
610.87
10G 4K (MB/s)
31.38
459.24
74.98
236.27
10G 4K-64Thrd (MB/s)
370.98
1185.63
264.00
957.68
10G Acc.time (ms)
0.056
0.144
0.442
0.186
Samsung 860 EVO's random reading and write speed comparison with RAPID mode OFF and ON (Test tool: AS SSD Benchmark; Blank disk) :
Radom
Normal mode
RAPID mode
1G 16MB/s (iops)
30.85
225.91
28.93
170.02
1G 4K (iops)
5642
18627
18947
105409
1G 4K-64 Thrd (iops)
91935
681472
77891
1486083
1G 512B (iops)
12611
12828
24664
74177
10G 16MB (iops)
32.55
37.00
30.47
38.00
10G 4K (iops)
7403
148243
19192
110382
10G 4K-64Thrd (iops)
91807
616556
75864
294322
10G 512B (iops)
16474
11544
2176
8319
Reading and writing data after Samsung 860 EVO opens RAPID mode (Test tool: ATTO Disk Benchmark; Blank disk) :
From all the above data, some test performance of the Samsung 860 EVO was improved several times after the RAPID mode on. The value even exceeded the socket peak (the socket peak of SATA 3 was 600 MB/s). By detecting the use of RAM, we found that the amount of RAM used increased by about 10% (8 GB RAM). Therefore the above data could not truly reflect SSD performance but only showed that RAPID mode could significantly improve the system's reading and writing performance.
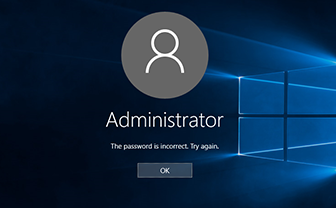
8. Management software
Good management software can help users get the SSD's better performance and prolong the SSD's life. SSD is generally equipped with corresponding management tools. These tools provide performance testing, TRIM, security erasure, S.M.A.R.T. information display, reserved storage space, temperature detection, firmware update, turn on RAPID mode and other functions.
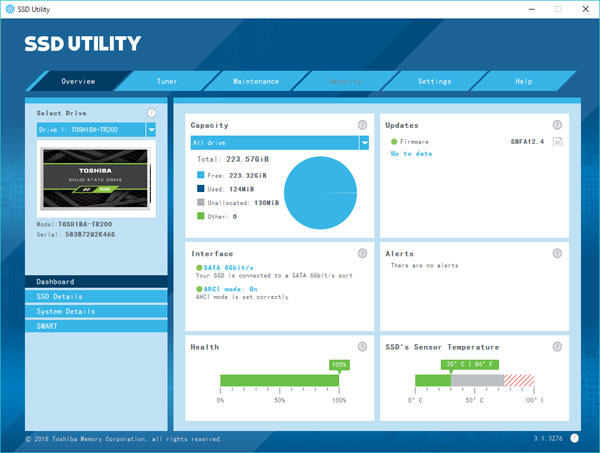
Toshiba TR200's management software :
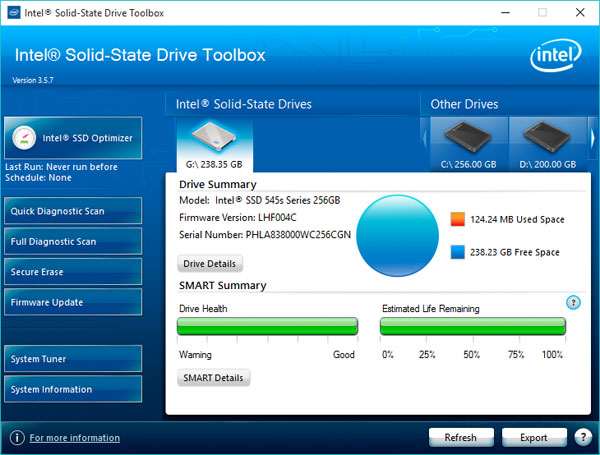
Intel 545s' management software :
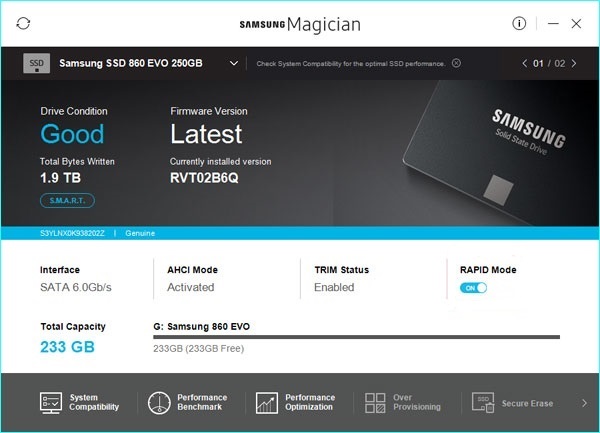
Samsung 860 EVO's management software :
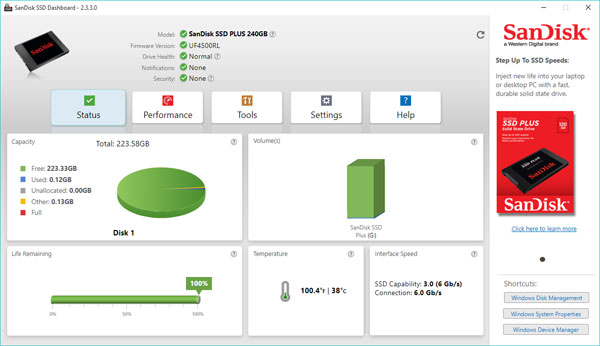
SanDisk SSD Plus's management software :
We don't get Toshiba Q200 EX's management software but downloaded the appropriate software for other SSDs. It's worth mentioning that Samsung's Samsung Magician is the best software in interface and function.
9. The Command code we used in testing
That's all. After reading this passage, do you get the ways of selecting SSD? If you have any queation, please tell us. Thank you.